
- LTC/BTC has been in a bearish trend for the last five years
- Bitcoin’s outperformance is likely to continue
- A descending triangle keeps the bearish bias intact
One of the most interesting markets to trade are cross pairs. Crosses are less liquid than major pairs and often move in tight ranges. This is a general rule for the classic currency market but also valid for cryptocurrency.
LTC/BTC is such a cross. It moves based on the differences in the prices of Litecoin and Bitcoin.
Since 2018, the market has been in a bearish trend. It means that Bitcoin has quite outperformed Litecoin in the past five years.
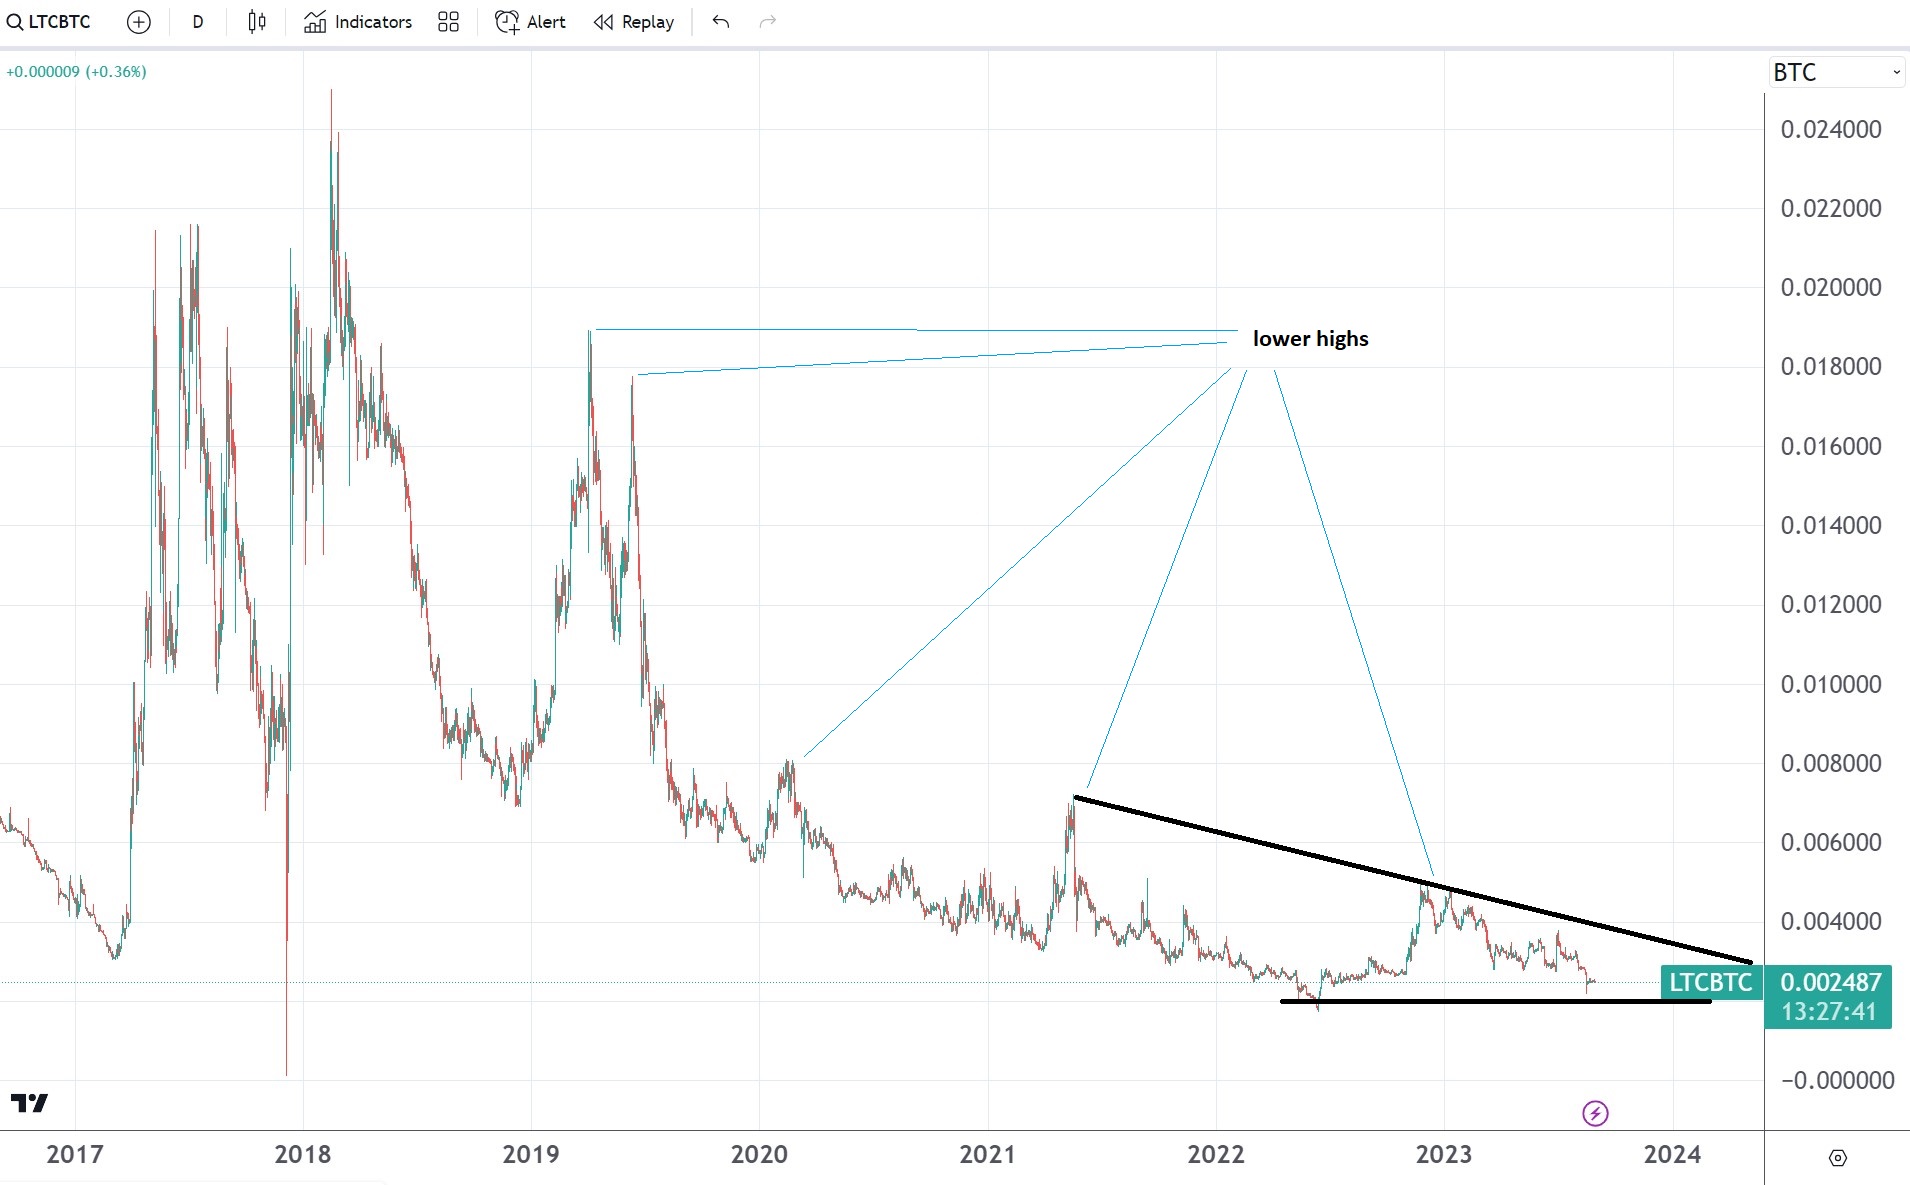
The chart above shows that the cross formed a series of lower highs and lower lows – characteristic in bearish triangles. Also, the bearish bias remains strong due to the presence of a descending triangle.
A descending triangle is a bearish continuation pattern. Its measured move equals the size of the longest segment of the triangle, projected from the horizontal base.
Therefore, traders may want to wait for the triangle to break lower before shorting the cross with a stop at the previous lower high.
What moves a cross?
Other rates influence a cross pair’s movements. In this case, the LTC/BTC cross pair reflects the differences between the LTC/USD and BTC/USD pairs.
Because the cross is in a bearish trend, Bitcoin outperformed Litecoin in the last five years. In other words, it means that Bitcoin was a better investment than Litecoin. Given the bearish bias for the cross, Bitcoin’s outperformance should continue.
For more news at Break’n News – click here
Break’n Pics – Click here for Free Stock Photos
GoCoin – Latest Cryptocurrency News and Trading


 Bitcoin
  Ethereum
  Solana
  USDC
USDC  XRP
XRP  Dogecoin
  Cardano
  Shiba Inu
  Polkadot
  Litecoin
  Stellar
  Helium
  Ravencoin
  Uquid Coin